Browse Definitions :
Definition

Pareto chart (Pareto distribution diagram)

A Pareto chart, also called a Pareto distribution diagram, is a vertical bar graph in which values are plotted in decreasing order of relative frequency from left to right. Pareto charts are extremely useful for analyzing what problems need attention first because the taller bars on the chart, which represent frequency, clearly illustrate which variables have the greatest cumulative effect on a given system. 

The Pareto chart provides a graphic depiction of the Pareto principle, a theory maintaining that 80% of the output in a given situation or system is produced by 20% of the input. 

The Pareto chart is one of the seven basic tools of quality control. The independent variables on the chart are shown on the horizontal axis and the dependent variables are portrayed as the heights of bars. A point-to-point graph, which shows the cumulative relative frequency, may be superimposed on the bar graph. Because the values of the statistical variables are placed in order of relative frequency, the graph clearly reveals which factors have the greatest impact and where attention is likely to yield the greatest benefit.

A Simple Example

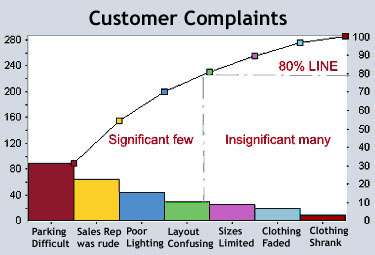
A Pareto chart can be used to quickly identify what business issues need attention. By using hard data instead of intuition, there can be no question about what problems are influencing the outcome most. In the example below, XYZ Clothing Store was seeing a steady decline in business. Before the manager did a customer survey, he assumed the decline was due to customer dissatisfaction with the clothing line he was selling and he blamed his supply chain for his problems. After charting the frequency of the answers in his customer survey, however, it was very clear that the real reasons for the decline of his business had nothing to do with his supply chain. By collecting data and displaying it in a Pareto chart, the manager could see which variables were having the most influence. In this example, parking difficulties, rude sales people and poor lighting were hurting his business most. Following the Pareto Principle, those are the areas where he should focus his attention to build his business back up. 

pareto chart

See also: flowchart, histogram

This was last updated in March 2011

Continue Reading About Pareto chart (Pareto distribution diagram)

Networking
  • local area network (LAN)

    A local area network (LAN) is a group of computers and peripheral devices that are connected together within a distinct ...

  • TCP/IP

    TCP/IP stands for Transmission Control Protocol/Internet Protocol and is a suite of communication protocols used to interconnect ...

  • firewall as a service (FWaaS)

    Firewall as a service (FWaaS), also known as a cloud firewall, is a service that provides cloud-based network traffic analysis ...

Security
  • identity management (ID management)

    Identity management (ID management) is the organizational process for ensuring individuals have the appropriate access to ...

  • fraud detection

    Fraud detection is a set of activities undertaken to prevent money or property from being obtained through false pretenses.

  • single sign-on (SSO)

    Single sign-on (SSO) is a session and user authentication service that permits a user to use one set of login credentials -- for ...

CIO
  • IT budget

    IT budget is the amount of money spent on an organization's information technology systems and services. It includes compensation...

  • project scope

    Project scope is the part of project planning that involves determining and documenting a list of specific project goals, ...

  • core competencies

    For any organization, its core competencies refer to the capabilities, knowledge, skills and resources that constitute its '...

HRSoftware
  • Workday

    Workday is a cloud-based software vendor that specializes in human capital management (HCM) and financial management applications.

  • recruitment management system (RMS)

    A recruitment management system (RMS) is a set of tools designed to manage the employee recruiting and hiring process. It might ...

  • core HR (core human resources)

    Core HR (core human resources) is an umbrella term that refers to the basic tasks and functions of an HR department as it manages...

Customer Experience
  • martech (marketing technology)

    Martech (marketing technology) refers to the integration of software tools, platforms, and applications designed to streamline ...

  • transactional marketing

    Transactional marketing is a business strategy that focuses on single, point-of-sale transactions.

  • customer profiling

    Customer profiling is the detailed and systematic process of constructing a clear portrait of a company's ideal customer by ...

Close