infographic

What is an infographic?
An infographic (information graphic) is a representation of information in a graphic format designed to make the data easily understandable at a glance.
People use infographics to quickly communicate a message, simplify the presentation of large amounts of data, see data patterns and relationships, and monitor changes in variables.
Infographics have become increasingly popular because of their ability to quickly convey large amounts of information in an appealing package.
How are infographics made?
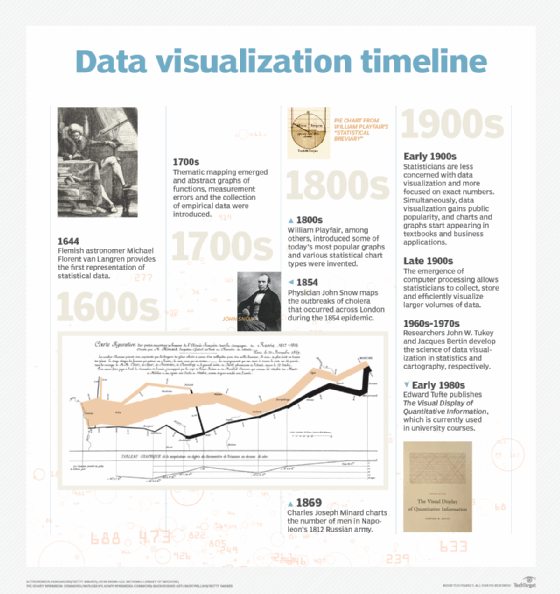
The process of creating infographics is sometimes referred to as data visualization. Designers start by researching the topic and gathering data and then organizing it into a visual format. This can include creating charts, graphs, maps, timelines or other visuals to help tell the story.
As infographics' popularity has grown, infographic creators have become more creative with their designs, using animations and interactive elements to provide a more engaging experience for viewers.
Once the infographic is designed, it can be shared with viewers online via social media platforms, such as Twitter and Facebook, or through print materials, like brochures and posters.
Do you have to be a designer to create an infographic?
People and organizations don't have to be professional designers in order to create an infographic. There are many online infographic-making tools that make it easy for anyone to make engaging visuals from data. These programs come with templates and design options so they can customize their infographic without any coding or graphic design experience.
What are some use cases for infographics?
Infographics predate writing as a means of disseminating information -- cave drawings are probably the earliest known example. People were also creating and using maps before the advent of written language.
Today, infographics abound in almost any public environment -- traffic signs, subway maps, tag clouds, musical scores and weather charts are just a few examples, among a huge number of possibilities.
Below are a few more use cases for infographics.
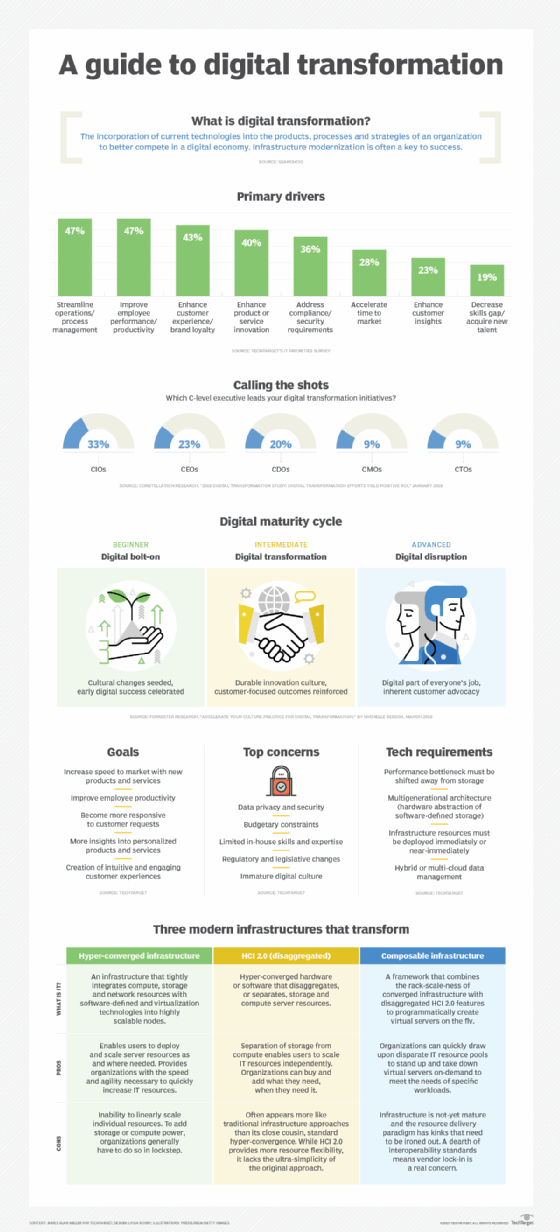
Enterprise
In the enterprise, infographics are used by all levels of management for high-level views of data. Infographics include bar graphs, pie charts, histograms, line charts, tree diagrams, mind maps, Gantt charts and network diagrams. Such tools are often components of business intelligence software.
As the amount of data being amassed in the enterprise and elsewhere increases, infographics are being used more and more frequently to help people understand the information contained in that data.
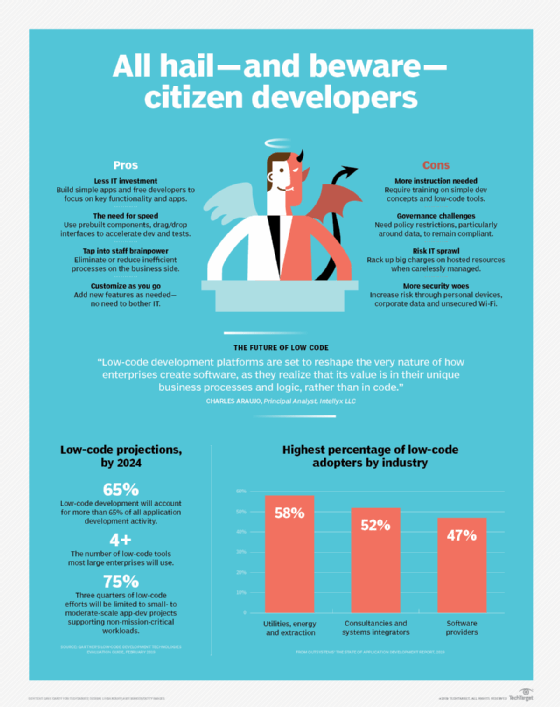
Digital marketing
In digital marketing, infographics can help companies make their products more visible online. By creating visually attractive content that conveys useful facts and figures about the product, customers are more likely to remember it. Furthermore, infographics can help marketers attract potential customers from social media platforms with eye-catching visuals.
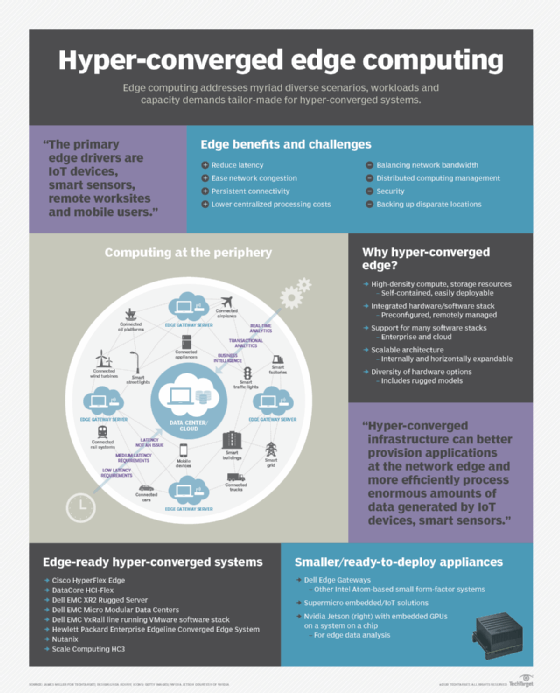
IT
In IT, an infographic can be used to illustrate a project's progress or help explain systems or application architecture for new employees. They also provide succinct summaries that help speed up the decision-making process.
Education
Infographics can also be beneficial in education, as they encourage learners to interact with complex topics and concepts in a visual way. By presenting information through visuals, students are more likely to remember the material and stay engaged in the learning process.
Learn eight steps to improve data visualization literacy, see how to enhance your data science storytelling and check out seven good data visualization practices for visual integrity.