Karnaugh map (K-map)

What is a Karnaugh map (K-map)?
A Karnaugh map (K-map) is a visual method used to simplify the algebraic expressions in Boolean functions without having to resort to complex theorems or equation manipulations. A K-map can be thought of as a special version of a truth table that makes it easier to map out parameter values and arrive at a simplified Boolean expression.
A K-map is best suited for Functions with two to four variables. Although K-maps can be used for functions with five or six variables, the process is more difficult. Using K-maps for functions with seven or more variables is extremely difficult -- if not impossible.
What is a Karnaugh map example?
The best way to understand how a K-map works is to see one in action, and the place to start is with a Boolean function. The following function defines a basic Boolean expression that incorporates the function's four variables:
f(A, B, C, D) = A̅BC̅D + ABC̅D̅ + ABC̅D + ABCD + ABCD̅ + AB̅CD + AB̅CD̅
The expression includes seven products -- based on parameter input -- that are added together to produce a single binary value. Several of the parameters are shown with a bar over them. The bar is a logical NOT operator. Like other logical operators in Boolean expressions, the NOT operator helps to control an expression's logic. When the operator is used, it indicates that the input value should be inverted to produce a different output value. In other words, if the input is 0, the output should be 1, or vice versa.
One way to help better understand this expression is to break it down into a truth table. Because there are four parameters, the table includes a column for each one. The table also contains a row for each possible combination of parameter values. The last column lists the function's returned value for each combination.
| Decimal | A | B | C | D | f |
| 0 | 0 | 0 | 0 | 0 | 0 |
| 1 | 0 | 0 | 0 | 1 | 0 |
| 2 | 0 | 0 | 1 | 0 | 0 |
| 3 | 0 | 0 | 1 | 1 | 0 |
| 4 | 0 | 1 | 0 | 0 | 0 |
| 5 | 0 | 1 | 0 | 1 | 1 |
| 6 | 0 | 1 | 1 | 0 | 0 |
| 7 | 0 | 1 | 1 | 1 | 0 |
| 8 | 1 | 0 | 0 | 0 | 0 |
| 9 | 1 | 0 | 0 | 1 | 0 |
| 10 | 1 | 0 | 1 | 0 | 1 |
| 11 | 1 | 0 | 1 | 1 | 1 |
| 12 | 1 | 1 | 0 | 0 | 1 |
| 13 | 1 | 1 | 0 | 1 | 1 |
| 14 | 1 | 1 | 1 | 0 | 1 |
| 15 | 1 | 1 | 1 | 1 | 1 |
The table also includes a column that shows the decimal equivalent for each row -- when treating the parameters as a single binary value. For example, the value for each parameter in the last row is 1, so the binary value of the four parameters is 1111, which is equivalent to a decimal value of 15. The decimal values can make it easier to track and reference the various combinations, as well as verify a K-map based on the same equation.
The truth table shows all the possible input combinations, along with their results; however, it doesn't help to simplify the original expression. For this, you need a K-map, which you can build directly from the expression or from the truth table. In either case, the goal is to figure out where to put the 1s on the K-map and, by extension, where to put the 0s.

For example, if you created a truth table for the preceding expression, you know that the decimal values 5, 10, 11, 12, 13, 14 and 15 all correspond to a return value of 1. You can use this information to populate the K-map. For this, you should start with a basic K-map shell, as shown here.
The K-map illustrated here is specific to a function that takes four parameters. It includes 16 cells, one for each possible combination of parameter values. Functions A and B are represented by the rows, and functions C and D are represented by the columns. The rows and columns are labeled with the possible combinations of parameter binary values. The labels must follow the order specified in the figure: 00, 01, 11 and 10. The columns are labeled from left to right, and the rows are labeled from top to bottom.
Each cell within the K-map represents the intersection of the Y-axis and X-axis coordinates, as they're represented by the column and row binary labels. For example, the third cell in the first row sits at the intersection of the 00 row and 11 column, so the cell itself represents the binary value 0011. In other words, the cell represents the parameter values A = 0, B = 0, C = 1 and D = 1.

In this case, the K-map also shows the decimal value. However, this is not always included nor is it necessary. It's been added in here to make it easier to compare the K-map to the truth table. It also provides an easy way to reference the cells. You can use this information to identify where to insert the 1 values on the K-map by referring back to the truth table. Rows in the truth table that have an output value of 1 (rows 5, 10, 11, 12, 13, 14 and 15) tell you directly where to place the 1s in the K-map (cells 5, 10, 11, 12, 13, 14 and 15). You can then enter a 0 in each remaining cell, as shown here.
If you did not create a truth table, you can instead calculate a binary value for each product group in the original expression and then use this information to map the 1s. All parameters listed with the NOT operator take a value of 0, and all other parameters take a value of 1:
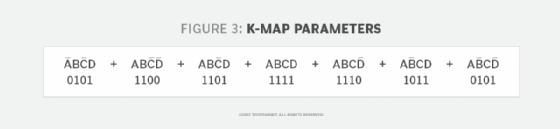
From this information, you can then fill in the K-map. For each four-digit binary value, enter a 1 in the cell associated with that value. For example, the first binary value in this equation is 0101, which corresponds to cell 5 in the K-map. As a result, you should enter a 1 in this cell, repeating the process for each of the other binary values. You can then insert a 0 in each of the remaining cells.
What is the K-map answer?
After you've set up the K-map, you can start grouping the 1s together to come up with an equation for each group, which is then added together to provide the final formula -- the K-map answer. The number of 1s in each group must be an integer to the power of 2, starting with 1, as in 1, 2, 4, 8 and so on. In addition, the 1s must connect with each other, although that connection can span the K-map's edges. For example, cells 2 and 10 can be grouped if they both contain 1s.
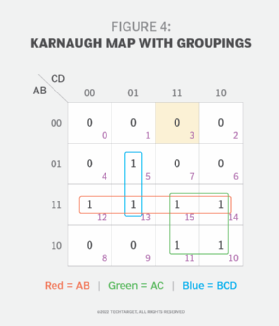
In the case of the expression shown above, there are three groups that meet the criteria, as indicated here.
The red group includes all cells in the third row (12, 13, 15 and 14), the green group includes four cells from the third and fourth rows (15, 14, 11 and 10) and the blue group includes cells 5 and 13. Each 1 cell needs to be accounted for, even if it means overlapping. For example, the red group overlaps with the blue and green groups.
After you identify the 1 groups, you can start to calculate your final expression. For each group, determine which parameters do not change, using the row and column binary labels. For example, both C and D values change across the red group. The C parameter has the values 0, 0, 1 and 1, and the D parameter has the values 0, 1, 1 and 0. So, neither parameter is included in the equation. However, the A and B values do not change, given that they're all in the same row. As a result, the red group can be represented as AB.
The green group spans multiple columns and rows, so this calculation is a little different. The A parameter is 1 in both rows, but the B parameter changes (1, 0). So, A should be included but not B. The C parameter is also the same for both columns, but the D parameter changes (1, 0). This means that the resulting expression is AC.
The blue group spans two rows but only one column. The A parameter changes across the two rows (0, 1), but the B parameter does not change. So, B should be included but not A. The C and D parameters do not change, so they should both be included in the group equation. However, C is a 0 rather than a 1, so it must be included with a NOT operator. As a result, the equation for the blue group is BC̅D.
After you've calculated the equation for each group, you can put them all together to create the final -- and abbreviated -- expression:
f = AB + AC + BC̅D
At this point, it's always a good idea to test your new equation to ensure it delivers the expected results. For example, the following series of calculations tests the expression against binary value 0101, which is represented by cell 5 in the K-map and row 5 in the truth table:
f = AB + AC + BC̅D
f = (0 x 1) + (0 x 0) + (1 x 0̅ x 1)
f = (0 x 1) + (0 x 0) + (1 x 1 x 1)
f = 0 + 0 + 1
f = 1
The first step is to plug in the binary value for each parameter. In the second step, you must convert the C̅ parameter from 0 to 1 because of the NOT operator. The rest is just basic algebra that should return a value of 1, the expected result. If the calculations had returned a 0, you would know that something is wrong. It's also a good idea to run these calculations for some of the other binary values, just to be safe.
See also: fuzzy logic, binary-coded decimal and logic gate.