data mining
What is data mining?
Data mining is the process of sorting through large data sets to identify patterns and relationships that can help solve business problems through data analysis. Data mining techniques and tools help enterprises to predict future trends and make more informed business decisions.
Data mining is a key part of data analytics and one of the core disciplines in data science, which uses advanced analytics techniques to find useful information in data sets. At a more granular level, data mining is a step in the knowledge discovery in databases (KDD) process, a data science methodology for gathering, processing and analyzing data. Data mining and KDD are sometimes referred to interchangeably, but they're more commonly seen as distinct things.
The process of data mining relies on the effective implementation of data collection, warehousing and processing. Data mining can be used to describe a target data set, predict outcomes, detect fraud or security issues, learn more about a user base, or detect bottlenecks and dependencies. It can also be performed automatically or semiautomatically.
Data mining is more useful today due to the growth of big data and data warehousing. Data specialists who use data mining must have coding and programming language experience, as well as statistical knowledge to clean, process and interpret data.
Why is data mining important?
Data mining is a crucial component of successful analytics initiatives in organizations. Data specialists can use the information it generates in business intelligence (BI) and advanced analytics applications that involve analysis of historical data, as well as real-time analytics applications that examine streaming data as it's created or collected.
Effective data mining aids in various aspects of planning business strategies and managing operations. This includes customer-facing functions, such as marketing, advertising, sales and customer support, as well as manufacturing, supply chain management (SCM), finance and human resources (HR). Data mining supports fraud detection, risk management, cybersecurity planning and many other critical business use cases. It also plays an important role in other areas, including healthcare, government, scientific research, mathematics and sports.
The data mining process: How does data mining work?
Data scientists and other skilled BI and analytics professionals typically perform data mining. But data-savvy business analysts, executives and workers who function as citizen data scientists in an organization can also perform data mining.
The core elements of data mining include machine learning and statistical analysis, along with data management tasks done to prepare data for analysis. The use of machine learning algorithms and artificial intelligence (AI) tools has automated more of the process. These tools have also made it easier to mine massive data sets, such as customer databases, transaction records and log files from web servers, mobile apps and sensors.
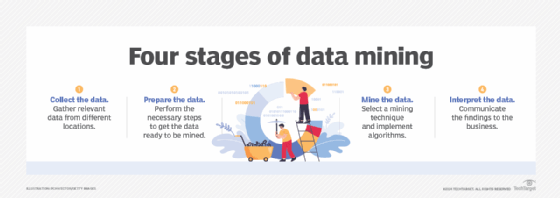
Although the number of stages can differ depending on how granular an organization wants each step to be, the data mining process can generally be broken down into the following four primary stages:
- Data gathering. Identify and assemble relevant data for an analytics application. The data might be located in different source systems, a data warehouse or a data lake, an increasingly common repository in big data environments that contain a mix of structured and unstructured data. External data sources can also be used. Wherever the data comes from, a data scientist often moves it to a data lake for the remaining steps in the process.
- Data preparation. This stage includes a set of steps to get the data ready to be mined. Data preparation starts with data exploration, profiling and pre-processing, followed by data cleansing work to fix errors and other data quality issues, such as duplicate or missing values. Data transformation is also done to make data sets consistent, unless a data scientist wants to analyze unfiltered raw data for a particular application.
- Data mining. Once the data is prepared, a data scientist chooses the appropriate data mining technique and then implements one or more algorithms to do the mining. These techniques, for example, could analyze data relationships and detect patterns, associations and correlations. In machine learning applications, the algorithms typically must be trained on sample data sets to look for the information being sought before they're run against the full set of data.
- Data analysis and interpretation. The data mining results are used to create analytical models that can help drive decision-making and other business actions. The data scientist or another member of a data science team must also communicate the findings to business executives and users, often through data visualization and the use of data storytelling techniques.
Types of data mining techniques
Various techniques can be used to mine data for different data science applications. Pattern recognition is a common data mining use case, as is anomaly detection, which helps identify outlier values in data sets. Popular data mining techniques include the following types:
- Association rule mining. In data mining, association rules are if-then statements that identify relationships between data elements. Support and confidence criteria are used to assess the relationships. Support measures how frequently the related elements appear in a data set, while confidence reflects the number of times an if-then statement is accurate.
- Classification. This approach assigns the elements in data sets to different categories defined as part of the data mining process. Decision trees, Naive Bayes classifiers, k-nearest neighbors (KNN) and logistic regression are examples of classification methods.
- Clustering. In this case, data elements that share particular characteristics are grouped together into clusters as part of data mining applications. Examples include k-means clustering, hierarchical clustering and Gaussian mixture models.
- Regression. This method finds relationships in data sets by calculating predicted data values based on a set of variables. Linear regression and multivariate regression are examples. Decision trees and other classification methods can also be used to do regressions.
- Sequence and path analysis. Data can also be mined to look for patterns in which a particular set of events or values leads to later ones.
- Neural networks. A neural network is a set of algorithms that simulates the activity of the human brain, where data is processed using nodes. Neural networks are particularly useful in complex pattern recognition applications involving deep learning, a more advanced offshoot of machine learning.
- Decision trees. This process classifies or predicts potential results using either classification or regression methods. Treelike structures are used to represent the potential decision outcomes.
- KNN. This data mining method classifies data based on its proximity to other data points. Assuming nearby data points are more similar to each other than other data points, KNN is used to predict group features.
Data mining software and tools
Numerous vendors offer data mining tools, typically as part of software platforms that also include other types of data science and advanced analytics tools. Data mining software provides key features, including data preparation capabilities, built-in algorithms, predictive modeling support, a graphical user interface-based development environment, and tools for deploying models and scoring how they perform.
A sampling of vendors that offer tools for data mining is Alteryx, Dataiku, H2O.ai, IBM, Knime, Microsoft, Oracle, RapidMiner, SAP, SAS Institute and Tibco Software.
A variety of free open source technologies can also be used to mine data, including DataMelt, Elki, Orange, Rattle, scikit-learn and Weka. Some software vendors also provide open source options. For example, Knime combines an open source analytics platform with commercial software for managing data science applications, while companies such as Dataiku and H2O.ai offer free versions of their tools.
Benefits of data mining
In general, the business benefits of data mining come from the increased ability of an organization to uncover hidden patterns, trends, correlations and anomalies in data sets. They can use that information to improve business decision-making and strategic planning through a combination of conventional data analysis and predictive analytics.
Specific data mining benefits include the following:
- More effective marketing and sales. Data mining helps marketers better understand customer behavior and preferences, which helps them create targeted marketing and advertising campaigns. Similarly, sales teams can use data mining results to improve lead conversion rates and sell additional products and services to existing customers.
- Better customer service. Data mining helps companies identify potential customer service issues more promptly and give contact center agents up-to-date information to use in calls and online chats with customers.
- Improved SCM. Organizations can spot market trends and forecast product demand more accurately, enabling them to better manage inventories of goods and supplies. Supply chain managers can also use information from data mining to optimize warehousing, distribution and other logistics operations.
- Increased production uptime. Mining operational data from sensors on manufacturing machines and other industrial equipment supports predictive maintenance applications to identify potential problems before they occur, helping to avoid unscheduled downtime.
- Stronger risk management. Risk managers and business executives can better assess financial, legal, cybersecurity and other risks to a company and develop plans for managing them.
- Lower costs. Data mining helps improve cost savings through operational efficiencies in business processes and reduces redundancy and waste in corporate spending.
Ultimately, data mining initiatives can lead to higher revenue and profits, as well as competitive advantages that set companies apart from their business rivals.
Industry examples of data mining
Organizations in the following industries use data mining as part of their analytics applications:
- Retail. Online retailers mine customer data and internet clickstream records to help them target marketing campaigns, ads and promotional offers to individual shoppers. Data mining and predictive modeling also power the recommendation engines that suggest possible purchases to website visitors, as well as inventory and SCM activities.
- Financial services. Banks and credit card companies use data mining tools to build financial risk models, detect fraudulent transactions, and vet loan and credit applications. Data mining also plays a key role in marketing and identifying potential upselling opportunities with existing customers.
- Insurance. Insurers rely on data mining to aid in pricing insurance policies and deciding whether to approve policy applications, as well as for risk modeling and managing prospective customers.
- Manufacturing. Data mining applications for manufacturers include efforts to improve uptime and operational efficiency in production plants, supply chain performance and product safety.
- Entertainment. Streaming services analyze what users are watching or listening to and make personalized recommendations based on their viewing and listening habits. Likewise, individuals might data mine software to learn more about it.
- Healthcare. Data mining helps doctors diagnose medical conditions, treat patients, and analyze X-rays and other medical imaging results. Medical research also depends heavily on data mining, machine learning and other forms of analytics.
- HR. HR departments typically work with large amounts of data. This includes retention, promotion, salary and benefit data. Data mining compares this data to better help HR processes.
- Social media. Social media companies use data mining to gather large amounts of data about users and their online activities. This data is controversially either used for targeted advertising or might be sold to third parties.
Data mining vs. data analytics and data warehousing
Data mining is sometimes considered synonymous with data analytics. But it's predominantly seen as a specific aspect of data analytics that automates the analysis of large data sets to discover information that otherwise couldn't be detected. That information can then be used in the data science process and in other BI and analytics applications.
Data warehousing supports data mining efforts by providing repositories for the data sets. Traditionally, historical data has been stored in enterprise data warehouses or smaller data marts built for individual business units or to hold specific subsets of data. Now, though, data mining applications are often served by data lakes that store both historical and streaming data and are based on big data platforms, like Hadoop and Spark; NoSQL databases; or cloud object storage services.
Data mining history and origins
Data warehousing, BI and analytics technologies began to emerge in the late 1980s and early 1990s, increasing organizations' abilities to analyze the growing amounts of data that they were creating and collecting. The term data mining was first used in 1983 by economist Michael Lovell and saw wider use by 1995 when the First International Conference on Knowledge Discovery and Data Mining was held in Montreal.
The event was sponsored by the Association for the Advancement of Artificial Intelligence, which also held the conference annually for the next three years. Since 1999, the Special Interest Group for Knowledge Discovery and Data Mining within the Association for Computing Machinery has primarily organized the ACM SIGKDD conference.
The technical journal, Data Mining and Knowledge Discovery, published its first issue in 1997. It's published bimonthly and contains peer-reviewed articles on data mining and knowledge discovery theories, techniques and practices. Another peer-reviewed publication, American Journal of Data Mining and Knowledge Discovery, was launched in 2016.
Data mining and process mining can both help organizations improve their performance. But how do these technologies compare? Learn more about their similarities and differences.